

OBD2 live data shows the values your vehicle's computer is reporting right now. To read it usefully, begin with a symptom, save the trouble codes and freeze-frame record, select only a few related PIDs, and compare their behavior under controlled conditions. A single unusual number is evidence to investigate—not proof that a part has failed.
What Is OBD2 Live Data?
OBD2 live data is a stream of current operating values made available by a vehicle control module through the diagnostic connector. Each available value is identified by a parameter ID, usually shortened to PID. Common standardized powertrain PIDs include engine speed, coolant temperature, fuel-system status, fuel trims, airflow, manifold pressure, throttle position, calculated load and vehicle speed.
The scanner is not measuring these values directly. It is requesting the information that the vehicle's computer sees or calculates. That distinction matters: an inaccurate sensor, damaged wiring, a substituted default value or an unsupported PID can all produce a reading that needs confirmation with other evidence.
| Information | What it shows | Best use |
|---|---|---|
| Trouble code | The system, circuit or monitor in which the ECU detected a fault. | Choose the correct diagnostic path; do not treat it as a failed-part verdict. |
| Freeze frame | A snapshot of selected conditions when a qualifying fault was stored. | Understand whether the fault occurred cold, hot, at idle, at speed or under load. |
| Live data | Values updating while the ECU and scanner communicate. | Compare behavior, reproduce a symptom safely and verify a repair. |
Standard OBD2 is not the whole vehicle. Regulated OBD data is primarily emissions and powertrain information. Manufacturer-specific live data from ABS, transmission, body, airbag or other modules requires the correct vehicle coverage, software and module access.
The OBD2 PIDs Worth Learning First
Do not select every PID simply because your scanner lists it. More requested values can reduce the refresh rate and make patterns harder to see. Start with the smallest group that can answer your diagnostic question.
| PID | What it represents | Useful way to read it |
|---|---|---|
| RPM | Engine speed reported by the ECU. | Use it as the timeline for idle stability, warm-up and changes made at a controlled engine speed. |
| Fuel-system status | Whether fuel control is open loop, closed loop or in another reported state. | Judge fuel trims and oxygen-sensor behavior only with the operating state in mind. |
| STFT and LTFT | Short-term and learned fuel corrections, usually reported by bank. | Compare direction and magnitude at warm idle and at a steady higher airflow condition. |
| ECT | Engine coolant temperature seen by the ECU. | Compare with ambient temperature before a cold start, then watch for a smooth warm-up and stable operation. |
| MAF | Measured intake-air mass on vehicles that use a mass-airflow sensor. | Look for a plausible, smooth rise with airflow and load; compare with vehicle-specific information. |
| MAP | Intake-manifold absolute pressure. | Compare key-on/engine-off pressure with local barometric conditions and observe its response to load. |
| O2 / air-fuel sensor | Exhaust feedback used for mixture control or catalyst monitoring. | Identify the sensor type first; narrowband voltage behavior and wideband data are not interpreted the same way. |
| Calculated load and throttle | ECU-calculated engine load and reported throttle or pedal position. | Provide context for airflow, fuel trims, temperature and the conditions recorded in freeze frame. |
How to Read Short-Term and Long-Term Fuel Trim
Short-term fuel trim (STFT) is the ECU's faster correction. Long-term fuel trim (LTFT) is the learned correction that changes more slowly. Positive trim means the ECU is adding fuel relative to its base command; negative trim means it is removing fuel.
On a warmed gasoline engine operating in closed loop, values relatively close to zero are generally preferable. A persistent combined correction around or beyond 10% in either direction is commonly treated as a reason to investigate, not a universal pass/fail limit. Engine design, fuel, altitude, temperature, operating state and manufacturer specifications all affect the interpretation.
Read the Pattern, Not Just the Number
Positive mainly at idle
If positive correction is high at idle but improves as airflow rises, unmetered air such as an intake or PCV leak becomes one reasonable direction to test. It is not proof of a vacuum leak.
Positive across conditions
If both banks remain positive at idle and under load, investigate fuel delivery, airflow measurement, exhaust leaks ahead of a sensor and other shared causes using the vehicle's test procedure.
Negative correction
The ECU is reducing fuel. Possible directions include excessive fuel delivery, purge flow, biased airflow or temperature inputs, and other rich-running causes. Confirm before replacing a sensor or injector.
One bank differs
A large bank-to-bank difference can help narrow the search to a bank-specific air leak, injector, exhaust leak, sensor circuit or mechanical condition. Cylinder layout and bank identification must be correct.
Do not diagnose from fuel trim while the engine is still in an unsuitable state. Cold enrichment, deceleration fuel cut, wide-open throttle and some fault strategies can make otherwise useful comparisons misleading.
How to Read O2 Sensors, MAF, MAP and Coolant Temperature
Oxygen and Air-Fuel Sensors
First identify whether the vehicle uses a conventional narrowband oxygen sensor or a wideband air-fuel sensor. A warmed narrowband upstream sensor may switch as the ECU corrects mixture in closed loop, while a wideband sensor may be displayed as current, lambda, equivalence ratio or a manufacturer-defined value. The familiar 0.1–0.9 V rule does not apply to every sensor.
A downstream sensor is used mainly to monitor catalyst behavior on many vehicles. It may look steadier than the upstream signal when the catalyst is storing oxygen effectively, but similar-looking graphs alone do not prove that a catalytic converter has failed. Codes, fuel control, exhaust leaks, sensor operation and manufacturer tests still matter.
Coolant Temperature
After a true cold soak, ECT and intake-air temperature should be reasonably consistent with the surrounding temperature. During warm-up, ECT should rise smoothly. The expected stabilized temperature and thermostat strategy vary by engine, so compare with service information instead of treating one internet temperature range as universal. This pattern is particularly useful when investigating a P0128 code.
MAF and MAP
MAF should respond smoothly as the engine moves more air, but the expected grams-per-second value depends on displacement, volumetric efficiency, RPM, load, forced induction and altitude. MAP must also be interpreted by engine type and operating condition. A gasoline engine commonly shows lower manifold absolute pressure at closed-throttle idle and a rise toward barometric pressure as load increases; diesel and boosted-engine strategies can look very different.
A Practical OBD2 Live-Data Workflow
Write down the symptom, when it occurs and whether the warning light is solid or flashing. If the engine is overheating, running dangerously poorly or showing a flashing MIL, stop and address safety first.
Record stored, pending and permanent codes where supported. Note related codes rather than focusing only on the first line shown.
Record engine speed, load, temperature, fuel status, trims, speed and other available conditions. Clearing diagnostic information may erase this evidence and reset readiness monitors.
For a lean-code or rough-idle investigation, begin with RPM, fuel-system status, both banks of STFT/LTFT, ECT and the relevant airflow or pressure value. Add data only when it answers a question.
Compare cold key-on values when useful, then warm idle. Record the conditions so a later test is genuinely comparable.
Use a controlled higher engine speed or an appropriate load test from the service procedure. For a road test, have a passenger operate the tool or record the data and review it after stopping.
Use inspection, smoke testing, pressure measurement, electrical checks or the manufacturer's pinpoint test before replacing a part. Repeat the same live-data comparison after repair.
Examples: Match the PIDs to the Problem
- Lean code or rough idle: review fuel status, STFT/LTFT by bank, MAF or MAP, upstream sensor response and RPM. See the full P0171 diagnostic guide.
- Random or multiple misfire: start with freeze frame, RPM stability, fuel trims and any supported cylinder-misfire counters. A P0300 code still requires ignition, air, fuel and mechanical checks.
- Slow warm-up: compare ECT with ambient before startup, then graph the warm-up curve and compare it with the manufacturer's thermostat strategy.
- Intermittent check-engine light: preserve freeze frame, record a focused group of PIDs and compare the live event with the original fault conditions before using the clear-code procedure.
Common Live-Data Mistakes
- Selecting dozens of PIDs and then missing a fast change because the refresh rate slowed.
- Using a generic “normal values” chart without accounting for sensor type, engine design and test conditions.
- Reading one snapshot instead of comparing a pattern over time.
- Assuming the part named in a code description must be the failed part.
- Confusing an unavailable PID with a zero reading.
- Clearing codes before recording freeze frame and readiness status.
- Watching a phone or scanner while driving instead of logging safely.
A Compact Scanner for Focused Live-Data Checks
If you want to compare several related values instead of scrolling through one long list, choose a tool that can graph and record a small group of PIDs. The useful feature is not the largest possible PID count—it is being able to see related values under the same operating condition.
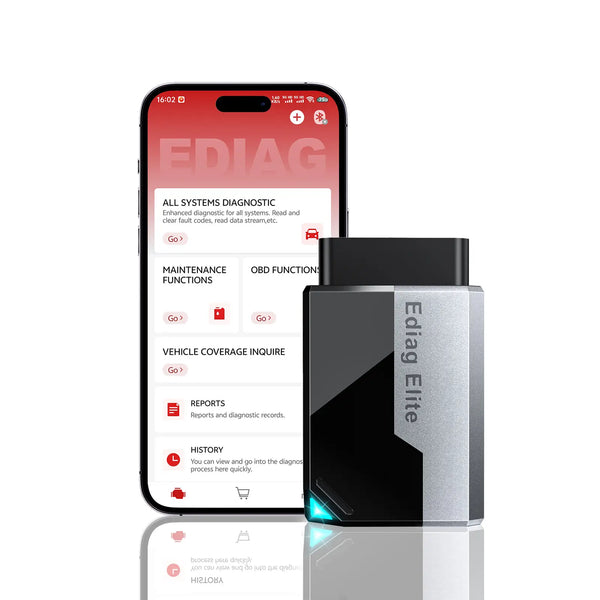
KINGBOLEN EDIAG Elite
For phone-based code, freeze-frame and four-stream live-data viewing.
EDIAG Elite includes standard OBDII live data and freeze frame, plus 4-in-1 graphing that can display up to four data streams together and record diagnostic data for later review.
See fit and limitations
- The vehicle and requested module must expose the data you want to view; not every vehicle supports every PID.
- Standard emissions live data and manufacturer-specific full-system data are different levels of access.
- Full-system diagnostics, active tests and service functions vary by make, model, year, module and software coverage.
- Use the vehicle-coverage lookup or contact EDIAGTOOL with the exact vehicle and required function before purchase.
Frequently Asked Questions
What is a PID on an OBD2 scanner?
What should STFT and LTFT be?
Why are some live-data values missing?
Is live data the same as freeze frame?
Can live data tell me exactly which part is bad?
Can I watch live data while driving?
Bottom line: Useful live-data diagnosis starts with a question, not a screen full of numbers. Preserve the original fault evidence, select a small group of related PIDs, compare patterns under known conditions and confirm the result with a second test. A tool such as the EDIAG Elite can make that comparison easier, but the data still needs vehicle-specific interpretation.
Product details checked September 3, 2026. Diagnostic data, supported PIDs and advanced functions vary by vehicle and may change with software coverage. Follow the current vehicle service information and scanner instructions.

